5 Star Analysis of Recipe Ratings
Introduction
This dataset is based off recipes and their ratings/reviews posted on food.com since 2008. There are two datasets, recipes and ratings, which we are combining to create one big dataset which contains information for 81,173 recipes. This vast dataset gives us a great way to predict a recipe’s ratings (which is the average rating column we created) based on numerous columns in our combined dataset, such as ‘minutes’ (amount of time to prepare a recipe), ‘nutrition’ (nutrition information of a recipe in the form of an array including its number of calories, total fat in PDV, sugar in PDV, sodium in PDV, protein in PDV, saturated fat in PDV, and carbohydrates in PDV), ‘n_steps’ (number of steps of a recipe) and ‘n_ingredients’ (the number of an ingredients needed for a recipe). This will help us understand which qualities are more or less influential in getting good rated recipes, meaning if someone wants good reviews to the recipe online, they know what factors would most influence their recipe’s ratings.
Data Overview
Data Cleaning
Firstly, since we are originally two datasets, we did a left merge between the datasets recipes and ratings. In our merged dataset, we replaced all ratings that contained a 0 with ‘np.nan’ as the number 0 may indicate a person gave a review without giving an official rating, messing up a recipe’s average rating as a result. We then created a new column called ‘average_rating’ to give a recipes average rating, which is helpful to our analysis as that is what we are investigating. We then dropped duplicate recipes with the same id, as we got our average rating per recipe, which is enough.
Furthermore, we have to split the column ‘nutrition’ into 7 different columns containing the values for a recipe’s calories, total fat, sugar, sodium, protein, saturated fat, and carbohydrates. This was easy as we just pieced apart an array and created a new column for each nutrition value.
We then removed the columns ‘id’, ‘contributor_id’, ‘nutrition’, ‘steps’, ‘tags’, ‘ingredients’, ‘submitted’, ‘description’, ‘user_id’, ‘recipe_id’, ‘date’, ‘rating’, and ‘review’ as these columns aren’t necessary for our analysis. We also drop any rows containing ‘nan’ values at this point as well.
We then got a dataframe cleaned for our analysis. Here is a look at its head below:
| name | minutes | n_steps | n_ingredients | average_rating | calories | total fat | sugar | sodium | protein | saturated fat | carbohydrates | |
|---|---|---|---|---|---|---|---|---|---|---|---|---|
| 0 | 1 brownies in the world best ever | 40 | 10 | 8 | 4.0 | 138.4 | 10.0 | 50.0 | 3.0 | 3.0 | 19.0 | 6.0 |
| 1 | 1 in canada chocolate chip cookies | 45 | 12 | 5 | 5.0 | 595.1 | 46.0 | 211.0 | 22.0 | 13.0 | 51.0 | 26.0 |
| 2 | 412 broccoli casserole | 40 | 6 | 9 | 5.0 | 194.8 | 20.0 | 6.0 | 32.0 | 22.0 | 36.0 | 3.0 |
| 6 | millionaire pound cake | 120 | 7 | 12 | 5.0 | 878.3 | 63.0 | 13.0 | 326.0 | 20.0 | 123.0 | 39.0 |
| 7 | 2000 meatloaf | 35 | 90 | 17 | 5.0 | 267.0 | 12.0 | 30.0 | 12.0 | 29.0 | 48.0 | 2.0 |
Univariate Analysis
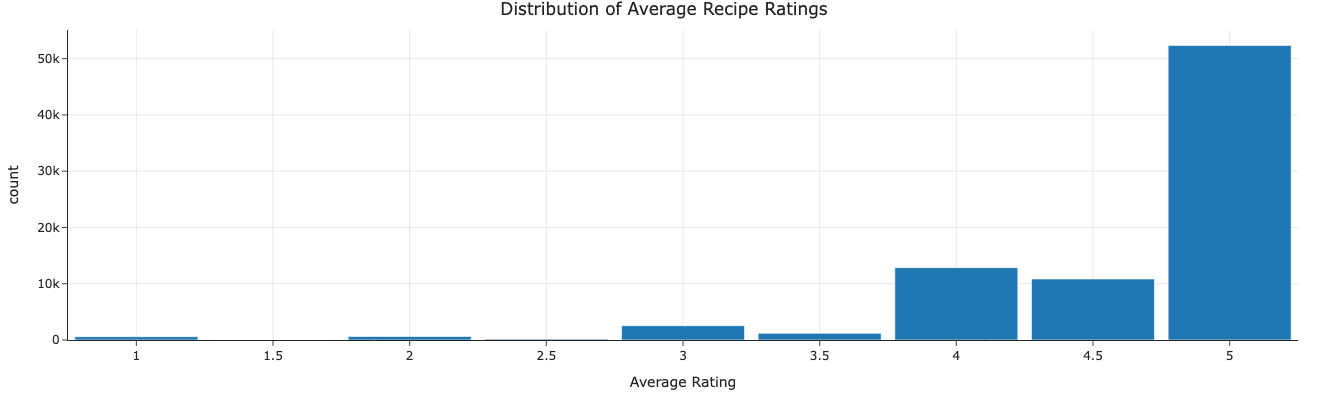
Below is a histogram giving a distribution of our average ratings. This is important as this is what we are trying to estimate based on other predictors and it’s good to know what ratings are more common and what ratings are rare. In this case, an average rating of 5 is by far the most common and the distribution is heavily skewed left, making it probably harder to predict a rating as a result.
Bivariate Analysis
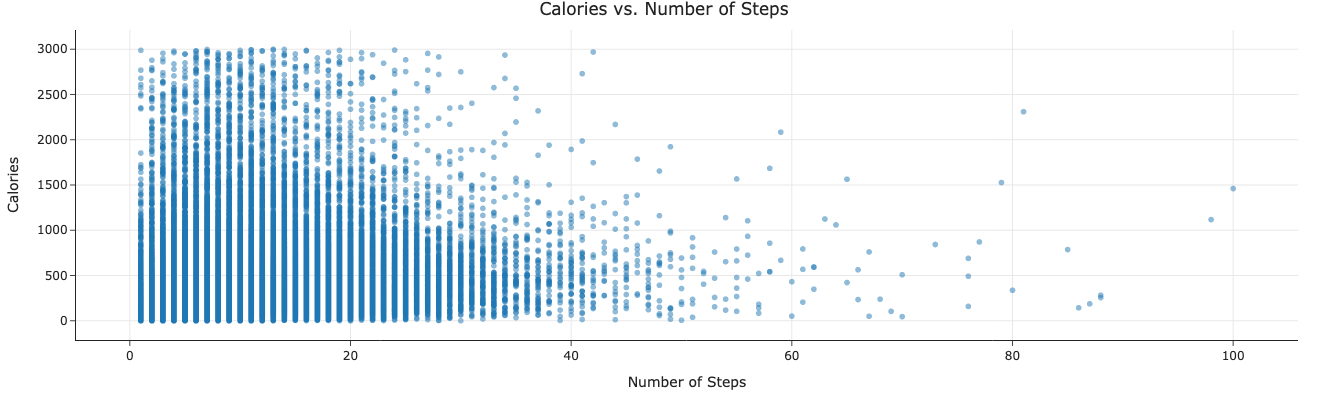
Below is a scatterplot between a recipe’s calories (capped at 3000 calories to prevent outliers and for cleaner graph viewing) and its number of steps. This is important as we need to check for relationships between the predictors to check for factors like collinearity. In this case, the recipes with fewer steps seem to have a wider range of calories while recipes that take more steps seem to have not so high calories. The scatterplot doesn’t appear to show any clear linear relationship between the two variables.
Interesting Aggregates
Below is our grouped aggregate table of a recipe’s average rating and several of its predictors (calories, number of ingredients, protein, and sugar). Here we can see some relationships like recipes with lower ratings having more calories and sugar. These relationships can help us understand our model better when we eventually construct it.
| rating_manual_bin | calories | n_ingredients | protein | sugar |
|---|---|---|---|---|
| 1.0–2.0 | 454.35 | 9.14 | 30.63 | 76.40 |
| 2.0–3.0 | 436.94 | 9.12 | 33.45 | 81.52 |
| 3.0–4.0 | 426.95 | 9.35 | 35.28 | 62.62 |
| 4.0–5.0 | 426.31 | 9.18 | 32.66 | 68.18 |
Imputation
I didn’t impute any values in our dataframe. This is due to the fact that different recipes have different values for its nutrition profile and its time needed, which is why we can’t really get a good idea of what to replace for a specific recipe’s ‘nan’ value. So, instead, we just removed them from our dataframe.
Problem Identification
Our prediction problem is trying to predict the average rating of a recipe based. This would be a regression problem as the average rating of a recipe is a continuous quantitative variable. Even though it is bounded between 1 and 5, it can be any rational number inside that range, meaning there are an infinite amount of average ratings possible for a recipe. Thus our response variable here is the average rating, which will help us identify how well received a recipe is from people trying it and rating it.
Our predictors used to predict the average rating of a recipe is a recipe’s number of ingredient, number of steps, the time it takes in minutes, and its nutrition statistics. These predictors will be known before a recipe is posted online, so it makes sense to use them to determine what a recipe’s average rating would be when it gets posted online.
We will use MSE (mean squared error) to evaluate our model as it works well in pointing large errors in our model. MSE is the best metric to use generally for linear models, which is why we chose them over other metrics like MAE (mean absolute error).
Baseline Model
Our baseline model is a linear regression model predicting a recipe’s average rating based on a recipe’s number of calories, number of steps, and number of ingredients. All three of our predictors are quantitive variables, meaning there are no ordinal or nominal variables in our model as a result. This means we don’t need do any encodings to any of our variables. However, for the quantitative variables in our model we use a StandardScalar in our ColumnTransformer to standardize them in our model. We included the ColumnTransformer in our sole pipeline of our model.
All this resulted in our baseline model MSE being around 0.4045. This is not much good as our model is too basic and may not account for nonlinear relationships that may exist. We also used way too few predictors as we have shown more variables that seemed to have sometype of relationship with a recipe’s average rating, even if it may be small.
Final Model
For our final model, we created two new features that should help our model be more accurate. Firstly, we created ‘calories_per_step’ which measures the average amount of calories in a meal per step. When looking at a recipe, having to look at more calories while preparing a recipe might impact one’s perception of a recipe, as we saw earlier higher rated recipes seemed to be slightly healthier. Secondly, we created ‘minutes_per_step’ which is the average amount of minutes per step. This could help us determine a recipe’s average rating as longer steps in a recipe might cause some people to get frustrated, making them more likely to give a lower rating for a recipe. We also added all remaining variables in a dataset to help predict average recipe’s average rating as at there might be some unseen relationships that could improve our model.
In our final model, we used the RandomForestRegressor method instead of the LinearRegression method as it would account for nonlinear relationships and has a better ability to capture distinct relationships between the predictors, resulting in a stronger model. We also used GridSearchCV on our model with 3-fold cross-validation on the model’s training data to further refine our model. The hyperparameters from the GridSearchCV that ended up performing the best are ‘regressor__max_depth’ = 10, ‘regressor__max_features’ = ‘sqrt’, ‘regressor__min_samples_split’ = 2, and ‘regressor__n_estimators’ = 100.
Our final model’s MSE is about 0.4029, which is lower than our baseline model’s MSE of 0.4045 by around 0.0016. Although our MSE decreased in our final model, it didn’t decrease by a large amount. This is an improvement because our new model included more predictors and accounted for more nonlinear relationships between variables. However, this only small decrease in our MSE can be explained by numerous factors, like how the vast majority of a recipe’s average ratings is between 4-5 stars, making it harder to draw meaningful relationships as most of our recipes, regardless of how distinct they maybe, are rated fairly high, while only a small number of recipes are rated low. This is despite us finding some small relationships between a recipe’s rating and its other characteristics, but it is really hard for our model to grasp due to the way data is given to it.